- 您现在的位置:买卖IC网 > Sheet目录336 > K2500GH (Littelfuse Inc)SIDAC 240-280VBO 1A H-ENERG DO15
�� �
�
�Teccor� ?� brand� Thyristors�
�High� Energy� Bidirectional� SIDACs�
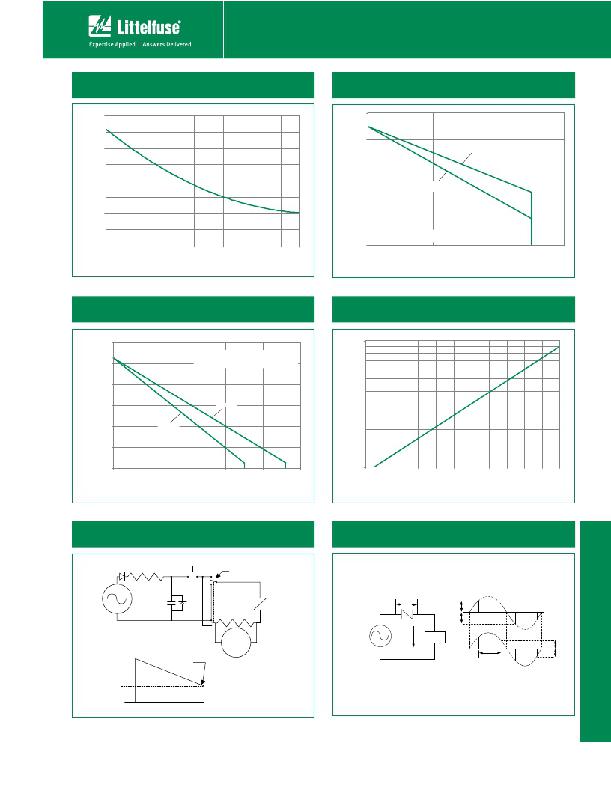
�Figure� 7:� Normalized� DC� Holding� Current�
�vs.� Junction� Temperature�
�2.0�
�1.5�
�Figure� 8:� Maximum� Allowable� Case� Temperature�
�vs.� RMS� On-State� Current�
�130�
�120�
�Kxxx0GH�
�110�
�1.0�
�100�
�Kxxx0SH�
�Kxxx0EH�
�0.5�
�90�
�CURRENT� WAVEFORM:� Sinusoidal� -� 60Hz�
�LOAD:� Resistive� or� Inductive�
�0.0�
�-40�
�-15�
�10�
�35�
�60�
�85�
�110�
�125�
�80�
�0.0� 0.2� 0.4� 0.6�
�0.8�
�1.0�
�1.2�
�Junction� Temperature� (T� J� )� --� °C�
�Figure� 9:� Maximum� Allowable� Ambient� Temperature�
�vs.� RMS� On-State� Current�
�140�
�CURRENT� WAVEFORM� :� Sinus� oidal� -� 60Hz�
�RMS� On-State� Current� [I� T(RMS)� ]� -� Amps�
�Figure� 10:� Normalized� Repetitive� Peak� Breakover�
�Current� (I� BO� )� vs.� Junction� Temperature�
�10�
�120�
�100�
�80�
�60�
�40�
�20�
�Kxxx0SH�
�Kxxx0EH�
�LOAD:� Re� s� is� tive� or� Inductive�
�FREE� AIR� RATING�
�Kxxx0GH�
�1�
�0.0�
�0.2�
�0.4�
�0.6�
�0.8�
�1.0�
�20�
�30�
�40�
�50�
�60�
�70�
�80�
�90�
�100�
�110�
�120�
�130�
�RMS� On-State� Current� [I� T(RMS)� ]� -� Amps�
�Figure� 11:� Dynamic� Holding� Current� Test�
�Circuit� for� SIDACs�
�Push� to� test�
�Junction� Temperature� (T� J� )� --� °C�
�Figure� 12:� Basic� SIDAC� Circuit�
�100-250� V� ac�
�60� Hz�
�S1�
�Switch� to� test�
�in� each� direction�
�Device�
�100�
�1%�
�Under�
�Test�
�V� BO�
�V� BO�
�V� BO�
�100-250� V� ac�
�S1�
�60� Hz�
�I� H�
�Load�
�?�
�I� PK�
�Trace� Stops�
�Scope�
�120-145�
�Conduction�
�Angle�
�Load� Current�
�I� H�
�I� H�
�I� H�
�Scope� Indication�
�?2008� Littelfuse,� Inc.�
�Speci?cations� are� subject� to� change� without� notice.�
�Please� refer� to� http://www.littelfuse.com� for� current� information.�
�323�
�Revised:� August� 29,� 2008�
�Kxxx0yH� Series�
�发布紧急采购,3分钟左右您将得到回复。
相关PDF资料
K3601G
SIDAC 340-380VBO 1A MULTP DO15
KIT34704AEPEVBE
KIT EVALUATION MC34704A 8CH
KIT34704BEPEVBE
KIT EVALUATION MC34704B 5CH
KIT34712EPEVBE
KIT EVAL BOARD 3A 1MHZ
KIT34713EPEVBE
KIT EVAL BOARD 5A 1MHZ
KIT34716EPEVBE
KIT EVAL BOARD 1MHZ DUAL SW-MODE
KIT34717EPEVBE
KIT EVAL BOARD 5A 1.0MHZ
KS-1787-MG
SHELF SLIDING KEYBOARD ASSEMBLY
相关代理商/技术参数
K2500GHAP
功能描述:硅对称二端开关元件 250V Sidac DO15 High Energy
RoHS:否 制造商:Bourns 转折电流 VBO:40 V 最大转折电流 IBO:800 mA 不重复通态电流: 额定重复关闭状态电压 VDRM:25 V 关闭状态漏泄电流(在 VDRM IDRM 下): 保持电流(Ih 最大值):50 mA 开启状态电压:5 V 关闭状态电容 CO:120 pF 最大工作温度:+ 150 C 安装风格:SMD/SMT 封装 / 箱体:DO-214AA
K2500GHRP
功能描述:SIDAC 250V 1A DO-15 RoHS:否 类别:分离式半导体产品 >> 二端交流开关元件,硅对称二端开关元件 系列:- 产品变化通告:Product Obsolescence 14/Apr/2010 标准包装:5,000 系列:- 电流 - 峰值输出:900mA 电压 - 击穿:150 ~ 170V 电流 - 维持(Ih):100mA 电流 - 击穿:200µA 封装/外壳:DO-204AL,DO-41,轴向 供应商设备封装:轴向 包装:带卷 (TR)
K2500GHU
功能描述:SIDAC 250V 1A DO-15 RoHS:否 类别:分离式半导体产品 >> 二端交流开关元件,硅对称二端开关元件 系列:- 产品变化通告:Product Obsolescence 14/Apr/2010 标准包装:5,000 系列:- 电流 - 峰值输出:900mA 电压 - 击穿:150 ~ 170V 电流 - 维持(Ih):100mA 电流 - 击穿:200µA 封装/外壳:DO-204AL,DO-41,轴向 供应商设备封装:轴向 包装:带卷 (TR)
K2500GHURP
功能描述:SIDAC 250V 1A DO-15 RoHS:否 类别:分离式半导体产品 >> 二端交流开关元件,硅对称二端开关元件 系列:- 产品变化通告:Product Obsolescence 14/Apr/2010 标准包装:5,000 系列:- 电流 - 峰值输出:900mA 电压 - 击穿:150 ~ 170V 电流 - 维持(Ih):100mA 电流 - 击穿:200µA 封装/外壳:DO-204AL,DO-41,轴向 供应商设备封装:轴向 包装:带卷 (TR)
K2500GRP
功能描述:硅对称二端开关元件 250V
RoHS:否 制造商:Bourns 转折电流 VBO:40 V 最大转折电流 IBO:800 mA 不重复通态电流: 额定重复关闭状态电压 VDRM:25 V 关闭状态漏泄电流(在 VDRM IDRM 下): 保持电流(Ih 最大值):50 mA 开启状态电压:5 V 关闭状态电容 CO:120 pF 最大工作温度:+ 150 C 安装风格:SMD/SMT 封装 / 箱体:DO-214AA
K2500S
功能描述:硅对称二端开关元件 250V
RoHS:否 制造商:Bourns 转折电流 VBO:40 V 最大转折电流 IBO:800 mA 不重复通态电流: 额定重复关闭状态电压 VDRM:25 V 关闭状态漏泄电流(在 VDRM IDRM 下): 保持电流(Ih 最大值):50 mA 开启状态电压:5 V 关闭状态电容 CO:120 pF 最大工作温度:+ 150 C 安装风格:SMD/SMT 封装 / 箱体:DO-214AA
K2500SHRP
功能描述:硅对称二端开关元件 SIDAC 250V HI ENERGY 2L
RoHS:否 制造商:Bourns 转折电流 VBO:40 V 最大转折电流 IBO:800 mA 不重复通态电流: 额定重复关闭状态电压 VDRM:25 V 关闭状态漏泄电流(在 VDRM IDRM 下): 保持电流(Ih 最大值):50 mA 开启状态电压:5 V 关闭状态电容 CO:120 pF 最大工作温度:+ 150 C 安装风格:SMD/SMT 封装 / 箱体:DO-214AA
K2500SRP
功能描述:硅对称二端开关元件 250V
RoHS:否 制造商:Bourns 转折电流 VBO:40 V 最大转折电流 IBO:800 mA 不重复通态电流: 额定重复关闭状态电压 VDRM:25 V 关闭状态漏泄电流(在 VDRM IDRM 下): 保持电流(Ih 最大值):50 mA 开启状态电压:5 V 关闭状态电容 CO:120 pF 最大工作温度:+ 150 C 安装风格:SMD/SMT 封装 / 箱体:DO-214AA